Evaluation AC6-06
Gas Turbine nozzle cascade
Application Challenge 6-06 © copyright ERCOFTAC 2004
Comparison of Test data and CFD
For the structured approach the computational I type grid (Fig 6.a ), consist of about 33000 nodes. The nodes belonging the the interior parts of the blade geometry are kept frozen setting to zero the time step for the advancement of the solution towards the steady state. For the hybrid unstructured approach (Fig. 6.b), a structured O type region around the blade wall is coupled with an outer unstructured part covering the remaining flow domain (14500 mixed triangle/quadrangle elements) and the solver HybFlow has been considered.
Figure 6a: Structured grid Figure 6b: Unstructured grid
Computed pressure profiles are compared against experiments in Fig. 7, for a coarse grid unstructured computation based on 7000 elements (MUR43 with isentropic exit Mach of 0.84; MUR47 to a higher outlet value of 1.02).
Figure 7a: test MUR43 Figure 7b: test MUR47
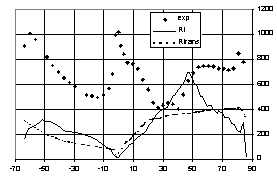
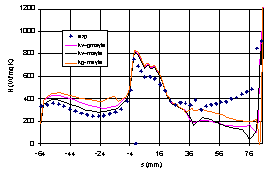
In Figure 8 and 9 the heat transfer coefficient is reported for the blade surface comparing several computations among them and against experiments. The test conditions are referring to the Test MUR241: Re(out)=2E6, Mis(out)=1.09 and incoming turbulence level Tu=6%. As observed, despite the different structured/unstructured implementation, all turbulence closures presented shows the same tendency to anticipate transition on the suction side of the blade regardless of the inlet flow turbulence level and turbulence length scale showing that traditional approaches basically fail to reproduce transition.
Figure 8a: MUR241 structured/unstructured solvers Figure 8b: MUR241 non linear and algebraic closures
Figure 9a: MUR241 k-ω with g transport equation Figure 9b: MUR241 Mayle transition onset
Besides linear constitutive laws perform approximately like non-linear closures while the choice of transported variables appear not playing a crucial role (k-ω or k-ε performs similar to k-w). The implementation of the intermittency transport equation in the turbulent closure does not improve by itself the modelling performances (Figure 9a).
The transition modelling approach based on the integral Mayle correlation proves a remarkable success in predicting the onset of laminar turbulent transition. Nevertheless, as shown in Figure 8b, 10a and 10b, the use of the Mayle correlation alone, although effective for the transition onset, does not guarantee a correct estimate of the transition length. A sudden transition is generally observed in all tests downstream the onset that is provided by the correlation and a miss-prediction of the heat transfer profile is appreciated especially on the blade suction side. This behaviour is evident regardless the addition in the two equation closure of the intermittency transport equation (3).
Figure 10a: MUR241k-ω modelling Figure 10b: MUR241k-w-g and k-ω-g with Mayle
The use of a second correlation for the transition length has been therefore considered for the improvement of the computation accuracy downstream the onset. For easy of use the Rodi-Michelassi correlation has been applied with the basic two equation k-ω model and Mayle criterion. The heat transfer profile shown in Figure 11a proves an improved agreement with experiments. Similar results come from the same use of the correlations approach using different two-equations turbulent closures.
Figure 11a: test MUR43 Figure 11b: test MUR47
The good agreement is justified from the profiles of momentum thickness reported in Figure 11b. As observed the computed exceeds the transition value obtained from Mayle correlation at the expected abscissa on both suction side and pressure side of the blade. On suction side transition is completed from the Rodi-Michelassi correlation just before s=50 where the experimental heat transfer coefficient stabilises at the value for fully turbulent flow.
A different flow condition Test MUR116 has been considered: Re(out)=2E6, Mis(out)=1.09, Tu=0.8%. The heat transfer distribution is shown in Figure 12a for different model arrangements all using the transition onset from Mayle correlation. The agreement on pressure side is satisfactory especially considering the k-w model. On the pressure side the Mayle correlation detects the correct onset for transition which occurs around s=80. Nevertheless, in the region between s=40¸75 ahead the transition, the computation underestimates appreciably the heat transfer growth observed in the experiments.
Figure 12a: test MUR116 Figure 12b: test MUR116
© copyright ERCOFTAC 2004
Contributors: Elisabetta Belardini, Francesco Martelli - Universita di Firenze
Site Design and Implementation: Atkins and UniS


