CFD Simulations AC1-01: Difference between revisions
No edit summary |
m (Dave.Ellacott moved page Silver:CFD Simulations AC1-01 to CFD Simulations AC1-01 over redirect) |
||
| (11 intermediate revisions by 3 users not shown) | |||
| Line 1: | Line 1: | ||
{{AC|front=AC 1-01|description=Description_AC1-01|testdata=Test Data_AC1-01|cfdsimulations=CFD Simulations_AC1-01|evaluation=Evaluation_AC1-01|qualityreview=Quality Review_AC1-01|bestpractice=Best Practice Advice_AC1-01|relatedUFRs=Related UFRs_AC1-01}} | |||
='''Aero-acoustic cavity'''= | ='''Aero-acoustic cavity'''= | ||
| Line 23: | Line 25: | ||
The calculations are performed in transient mode for a limited time span, sufficiently long to capture several limit-cycled periods (see also Figure 3), but starting from a steady state solution which may be converged (see also Figure 4) or for which the residuals have been minimized to ensure a representative starting solution. | The calculations are performed in transient mode for a limited time span, sufficiently long to capture several limit-cycled periods (see also Figure 3), but starting from a steady state solution which may be converged (see also Figure 4) or for which the residuals have been minimized to ensure a representative starting solution. | ||
'''Computational Domain''' | '''Computational Domain''' | ||
| Line 68: | Line 72: | ||
Figure 3. Residual histories for converged steady-state run | |||
[[Image:image008.gif]] | |||
Figure 4: Sample of CFD transient pressure trace (total 0.2 seconds) | |||
Figure 3 illustrates a typical steady-state residual history. The solution from such a calculation, used as the starting (time zero) solution for a transient calculation, produces a transient pressure history at the measurement points typified by Figure 4. | |||
The combined steady state and transient calculation take in the order of one to two days on a single processor machine (workstation or high performance PC processor) | |||
'''References''' | |||
References | |||
[2] Henderson J., Babcock K. and Richards B. E., “Subsonic and transonic transitional cavity flows”, AIAA-2000-1966, June 2000, 6th AIAA/CEAS Aeroacoustics Conference and Exhibit. | [2] Henderson J., Babcock K. and Richards B. E., “Subsonic and transonic transitional cavity flows”, AIAA-2000-1966, June 2000, 6th AIAA/CEAS Aeroacoustics Conference and Exhibit. | ||
| Line 108: | Line 99: | ||
[4] Mendonça, F., Allen, R., de Charentenay, J., Lewis, M., “Towards Understanding LES and DES for Industrial Aeroacoustics Predictions”, International workshop on ‘LES for Acoustics’, DLR Göttingen, Germany, 7-8th October 2002, | [4] Mendonça, F., Allen, R., de Charentenay, J., Lewis, M., “Towards Understanding LES and DES for Industrial Aeroacoustics Predictions”, International workshop on ‘LES for Acoustics’, DLR Göttingen, Germany, 7-8th October 2002, | ||
© copyright ERCOFTAC 2004 | © copyright ERCOFTAC 2004 | ||
---- | |||
Contributors: Fred Mendonca; Richard Allen - Computational Dynamics Ltd | Contributors: Fred Mendonca; Richard Allen - Computational Dynamics Ltd | ||
Site Design and Implementation: Atkins and UniS | Site Design and Implementation: [[Atkins]] and [[UniS]] | ||
{{AC|front=AC 1-01|description=Description_AC1-01|testdata=Test Data_AC1-01|cfdsimulations=CFD Simulations_AC1-01|evaluation=Evaluation_AC1-01|qualityreview=Quality Review_AC1-01|bestpractice=Best Practice Advice_AC1-01|relatedUFRs=Related UFRs_AC1-01}} | |||
Latest revision as of 14:40, 11 February 2017
Aero-acoustic cavity
Application Challenge 1-01 © copyright ERCOFTAC 2004
Overview of CFD Simulations
To date [2,3,4], various CFD codes have accurately predicted the more dominant narrow-band tones, and with limited success broad-band tones using 2D meshes, particularly in the case with doors deployed at 90o. Further investigation for 3D effects may improve this situation and this is being investigated. The results for 2D and 3D meshes using STAR-CD v3.1 and v3.15 will be made available to the project.
Simulation Case
Solution strategy
STAR-CD employs the following solution parameters;
- Conservation of mass, momentum and energy by solving the Navier-Stokes equations using the SIMPLE/PISO algorithm for compressible flow.
- Use of second-order spatial discretisation MARS scheme, (unstructured TVD), and optionally first-order (Euler implicit) or second-order (Crank-Nicholson) temporal discretisation.
- Turbulence represented optionally by eddy-viscosity, Reynolds-stress transport or large-eddy simulation.
The calculations are performed in transient mode for a limited time span, sufficiently long to capture several limit-cycled periods (see also Figure 3), but starting from a steady state solution which may be converged (see also Figure 4) or for which the residuals have been minimized to ensure a representative starting solution.
Computational Domain
Measurements taken off the centreline during the experimental study indicate that the 3D effects are not significant. Hence the case can be modelled as 'quasi-3D'. This allows the predictions of the fundamental flow physics to be evaluated for effects of grid and time-step dependency, turbulence model, order of temporal discretisation and other numerical settings.
The case can and will also be run 3D during the QNET project.
Boundary Conditions
The boundary conditions faithfully represent the test conditions listed in section 2.2. The upstream and top boundaries (Figure 2) are defined as inlets at M=0.85. The surfaces of the cavity, upstream and downstream are treated as rigid and non-slip. The downstream boundary is treated as a fixed pressure boundary and deemed to be far enough away to make any boundary reflection issues negligible. Symmetry planes are applied in the third dimension.
Application of Physical Models
For the calculations already completed, some results for which are reported below, a standard k-ε turbulence model with wall-functions was employed. The near-wall y+ values were approximately 20-100, reducing below that lower limit for a very small number of near-wall cells.
Numerical Accuracy
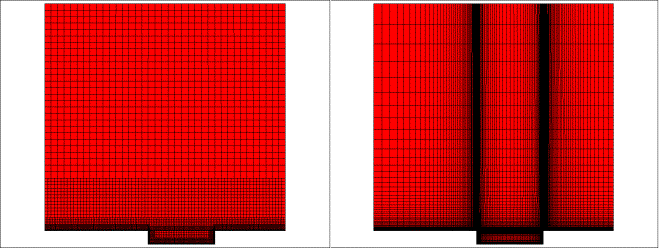
Mesh density and time-step size studies already undertaken for this calculation indicate the suitability of the calculation methodology for predicting the inherent flow and acoustic characteristics. These are discussed in more detail in Section 3.2.6 and Section 4. Figure 2 illustrates flow domain and typical coarse and fine mesh resolution for this geometry. Further studies will also be subject to similar sensitivity checks.
Figure 2: Coarse mesh (left) and fine mesh (right)
CFD Results
Sample results are presented below.
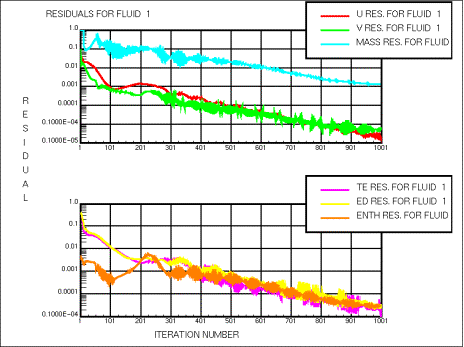
Figure 3. Residual histories for converged steady-state run
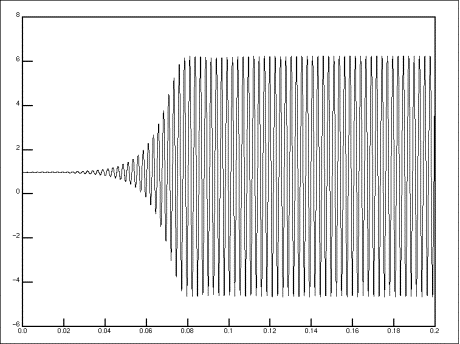
Figure 4: Sample of CFD transient pressure trace (total 0.2 seconds)
Figure 3 illustrates a typical steady-state residual history. The solution from such a calculation, used as the starting (time zero) solution for a transient calculation, produces a transient pressure history at the measurement points typified by Figure 4.
The combined steady state and transient calculation take in the order of one to two days on a single processor machine (workstation or high performance PC processor)
References
[2] Henderson J., Babcock K. and Richards B. E., “Subsonic and transonic transitional cavity flows”, AIAA-2000-1966, June 2000, 6th AIAA/CEAS Aeroacoustics Conference and Exhibit.
[3] Shieh C. M. and Morris P. J., “Parallel computational aeroacoustic simulation of turbulent subsonic cavity flow”, AIAA-2000-1914, June 2000, 6th AIAA/CEAS Aeroacoustics Conference and Exhibit.
[4] Mendonça, F., Allen, R., de Charentenay, J., Lewis, M., “Towards Understanding LES and DES for Industrial Aeroacoustics Predictions”, International workshop on ‘LES for Acoustics’, DLR Göttingen, Germany, 7-8th October 2002,
© copyright ERCOFTAC 2004
Contributors: Fred Mendonca; Richard Allen - Computational Dynamics Ltd
Site Design and Implementation: Atkins and UniS


