EXP 1-2 Experimental Set Up
Pollutant transport between a street canyon and a 3D urban array as a function of wind direction and roof height non-uniformity
Experimental Setup
The experiments were conducted under neutrally stratified conditions in the Environmental wind tunnel of the Institute of Thermomechanics of the Czech Academy of Sciences in Nový Knín (Fig. 1). It is an open low-velocity wind tunnel with cross dimensions of 1.5 × 1.5 m, the lengths of the development and test sections being 20.5 m and 2 m, respectively. The freestream velocity can be maintained within a range of 0.1-10 m s-1 by means of a frequency convertor of the fan with an accuracy of 0.05 m-1 by using a frequency converter of the fan. Since pollutant dispersion in urban areas is related to the atmospheric boundary layer developing over a terrain with such roughness, the corresponding approaching boundary layer was introduced at a scale of 1:400 by turbulence generators (a set of three spires, 1.4 m heigh) and then developed by a staggered arrangement of roughness elements (thin plates with a width and height of 50 mm) along the remaining part of the development section in the wind tunnel.

.
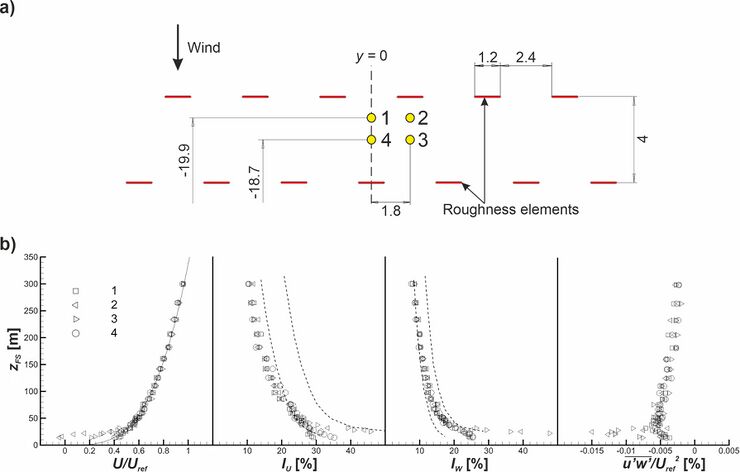
The properties of the boundary layer were measured at the wind tunnel free-stream velocity Uref = 6.2 m s-1 (measured with a Prandtl tube at a fixed position, 1 m above the wind tunnel floor and 4 m upwind from the test section) using 2D laser Doppler anemometry (LDA) at four positions between the roughness elements at the end of the development section. The position and characteristics of the best-fit vertical profile are presented in Figs. 2a and b, respectively. The main aerodynamic parameters of the simulated boundary layer were the roughness length, z0 = 1.87 m; displacement height, d0 = 3 m; and friction velocity, u* = 0.43 m s-1, all at full scale and turbulence characteristics of turbulence. The streamwise (Iu) and vertical (Iw) intensity of turbulence were in accordance with the guidelines of VDI (2000) [3]. We also calculated the integral length scales of the streamwise velocity component, Lu,x, from time series measured at 7 different heights across the boundary layer depth. For heights zFS < 50 m (full scale), these integral length scales were within the theoretical values for very rough terrain and in good agreement with the in-situ measurements [4].
Contributed by: Štěpán Nosek — Institute of Thermomechanics of the CAS, v. v. i.
© copyright ERCOFTAC 2024
