AC 6-10 Test Data
Axial compressor cascade
Application Challenge 6-10 © copyright ERCOFTAC 2004
Test Data
Overview of Measurements
Experimental investigations on the boundary layer and loss behaviour on a high turning compressor cascade up to 0.90 inlet Mach number were performed in the High Speed Cascade Wind Tunnel of DFVLR Braunschweig. The tunnel was installed in a tank which could be evacuated from 1 to 0.05 bar and an independent variation of Mach number and Reynolds number was possible. The degree of turbulence at inlet was about 5% using grids of crossed bars upstream of the cascade. The tunnel geometry is described in section 1.4. The design point of the V2 cascade is given by an inlet Mach number of 0.85, Reynolds number of 5E5 (based on blade chord), inlet flow angle of 139.5o and flow turning of 50o.
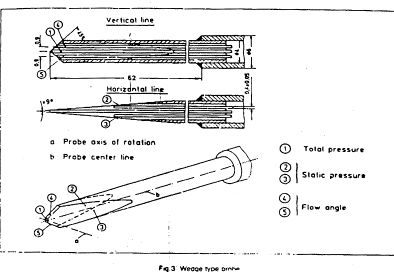
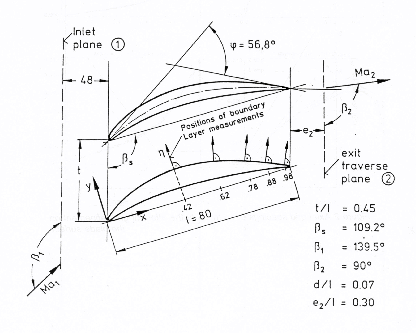
Wake traverse measurements (total pressure, static pressure and outlet flow angle) at mid-span position of blade number 8 were performed with a wedge type probe located at 30% of true chord axially downstream of the blade trailing edge. [A6-10exp.htm#Figure21 Figure 2.1] shows a diagram of the wedge probe used and [A6-10exp.htm#Figure22 Figure 2.2] shows the location of the measuring plane. Surface pressure distributions also at the midspan position were measured using static pressure tappings on the suction and the pressure sides of the blades adjacent to the center blade.
Figure 2.2 V2 Cascade geometry and locations of measurement planes
|
|
|
|
|
|
|
|
|
|
|
|
|
|
|
|
|
|
|
|
|
|
|
|
|
|
|
|
|
|
|
|
|
|
|
|
|
|
|
|
|
|
|
|
|
|
|
|
|
|
|
|
|
|
|
|
|
|
|
|
|
|
|
|
|
|
|
|
|
|
|
|
|
|
|
|
|
|
|
|
|
|
|
|
|
|
|
|
|
|
|
|
|
|
|
|
|
|
|
|
|
|
|
|
|
|
|
|
|
|
|
|
|
| |
|
|
| ||
|
|
| ||
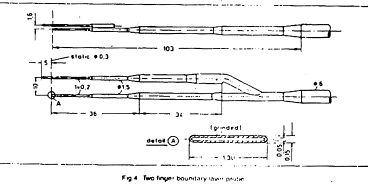
Boundary layer measurements were carried out at different positions on the blade suction side at the midspan position. [A6-10exp.htm#Figure22 Figure 2.2] shows the locations of the inlet and exit measuring planes and the locations of the boundary layer measurements. These boundary layer measurements were carried out with a specially developed two finger probe (see [A6-10exp.htm#Figure23 Figure 2.3]). The probe was calibrated for Mach and Reynolds number, flow angle and turbulence level. Corrections were applied from these calibrations on the basis of a comparison with flat plate experiments and with measurements by a Laser-Doppler anemometer. There is a high level of confidence in the experimental data and the case was chosen by AGARD Working Group 18.
Figure 2.3 Two finger boundary layer probe
Overview of tests
All the tests were carried out at an inlet Reynolds number of 5E5 based on blade chord and with a freestream turbulence intensity of 5%. The results are presented in two groups. EXP1-4 investigated a range of inlet mach numbers from 0.3 to 0.85 for the design inlet angle of 49.5 degrees and a constant Ω of 1.20. EXP7-EXP10 then demonstrated the influence of inlet angle at constant Mach number (M1=0.8) on different Ω values. These tests are summarized in [A6-10exp.htm#TableEXPA Table Exp-A].
In all tests the measured parameters were:
•Total pressure, static pressure and outlet flow angle at the mid-span position of blade number 8 at 30% of true chord axially downstream of the blade trailing edge.
•Surface pressure distributions also at the midspan position on the suction and the pressure sides of the blades adjacent to the center blade.
•Boundary layer measurements (total and static pressure through the boundary layer) were carried out at different positions (see [A6-10exp.htm#Figure22 Figure 2.2]) on the blade suction side at the midspan position.
The data corresponding to these measurements is summarized in [A6-10exp.htm#TableEXPB Table Exp-B].
Boundary Data
At the inlet boundary (station 1) the flow can be assumed steady, uniform pitchwise and turbulent. The turbulent intensity was calculated using a single hotwire probe placed normal to the freestream velocity from which a fluctuating velocity was obtained.
Pressure and temperature data is measured at the inlet and outlet.
The outflow measurement plane is located far enough downstream of the blade trailing edge to have no effect on the flow over the blade. The blade surfaces and the wall boundaries are considered to be smooth. The pitchwise boundaries for the measurement blade can be considered to be periodic.
Measurement Errors
The errors in measurement quantities for all tests are:
α = ±0.2degrees
M = ±0.003
ζ1 = ±0.001
Cp = ±0.005
The boundary layer probe was calibrated for Mach and Reynolds number, flow angle and turbulence level. Corrections were applied from these calibrations on the basis of a comparison with flat plate experiments and with measurements by a Laser-Doppler anemometer.
|
|
|
|
| ||||
|
|
|
|
|
|
|
| |
|
EXP 1 |
|
|
|
|
|
|
|
|
|
|
|
|
|
|
| |
|
EXP 2 |
|
|
|
|
|
|
|
|
|
|
|
|
|
|
| |
|
EXP 3 |
|
|
|
|
|
|
|
|
|
|
|
|
|
|
| |
|
EXP 4 |
|
|
|
|
|
|
|
|
|
|
|
|
|
|
| |
|
EXP 7 |
|
|
|
|
|
|
|
|
|
|
|
|
|
|
| |
|
EXP 8 |
|
|
|
|
|
|
|
|
|
|
|
|
|
|
| |
|
EXP 9 |
|
|
|
|
|
|
|
|
|
|
|
|
|
|
| |
|
EXP 10 |
|
|
|
|
|
|
|
Table EXP-A Summary description of all test cases
|
|
|
|
| |
|
EXP 1 |
|
|
|
|
|
EXP 2 |
|
|
|
|
|
EXP 3 |
|
|
|
|
|
EXP 4 |
|
|
|
|
|
EXP 7 |
|
|
|
|
|
EXP 8 |
|
|
|
|
|
EXP 9 |
|
|
|
|
|
EXP 10 |
|
|
|
|
Table EXP-B Summary description of all measured parameters and available datafiles
Test Case EXP-1
EXP1 Measurements on the V2 high subsonic linear compressor cascade: The test was carried out with an inlet mach number of 0.3 for the design inlet angle of 49.5 degrees and a constant Ω of 1.20. Reynolds number at inlet was 5E5 based on blade chord and turbulence intensity was 5%. Data was recorded for total and static pressure and flow direction at stations 1 and 2 corresponding to inlet and exit planes respectively. Pressure distribution through the boundary layer was recorded at several locations on the blade suction surface.
exp11.dat (ASCII file; headers: Re, Tu; M1, α1, Ω. columns: x/l, Cp)
exp12.dat (ASCII file; headers: Re, Tu; M1, α1, Ω. columns: y/t, ω)
exp13.dat (ASCII file; headers: Re, Tu; M1, α1, Ω, x/l. columns: h, w/w∞)
exp14.dat (ASCII file; headers: Re, Tu; M1, α1, Ω. Data: M2, α2, ζ1)
Test Case EXP-2
See EXP 1: M1=0.6, α1=49.5, Ω=1.2
Test Case EXP-3
See EXP 1: M1=0.8, α1=49.5, Ω=1.2
Test Case EXP-4
See EXP 1: M1=0.85, α1=49.5, Ω=1.2
Test Case EXP-7
See EXP 1: M1=0.8, α1=49.5, Ω=1.12
Test Case EXP-8
See EXP 1: M1=0.8, α1=49.5, Ω=1.27
Test Case EXP-9
See EXP 1: M1=0.8, α1=52.5, Ω=1.12
Test Case EXP-10
See EXP 1: M1=0.8, α1=52.5, Ω=1.3
References
2.1 'Test cases for computation of internal flows in aero engine components', L. Fottner, Propulsion and Energetics Panel Working Group 18, AGARD Advisory report No. 275, 1990.
© copyright ERCOFTAC 2004
Contributors: Michael Dickens; Alex Read - Computational Dynamics Ltd


