UFR 1-01 Evaluation
Underexpanded jet
Underlying Flow Regime 1-01 © copyright ERCOFTAC 2004
Evaluation
Comparison of CFD calculations with Experiments
6.1 the Moderately Under-expanded Jet :
In this section, the modelling results from k-ε schemes, and an RSM scheme, will be assessed against the experimental data of Seiner and Norum (1979, 1980), for moderately under-expanded jets. CFD modeling results are available from: Cumber et al. (1994) using the k-ε schemes; from Bartosiewicz et al (2002) using an RSM scheme; and finally (co-plotted by Bartosiewicz) from an alternative k-ε scheme computed by Pao and Abdol-Hamid (1996). The latter two papers attribute the experimental work to Seiner, Dash and Wolf (1985), although the true origin appears to have been Seiners earlier (1979 & 1980) papers.
Figure 3, taken from Cumber et al. (1994), shows the radial values of Mach number at four different downstream locations, as computed with the two models, alongside the corresponding experimental data. This is for the moderately under-expanded jet with a pressure ratio of P1/P∞ = 1.45 and an exit Mach number of M=2. The Mach number can be seen to peak off the jet centreline for the first two locations (z/d=2.25 and z/d=3.25), and the final location at z/d=5; and drops rapidly away from this off-axis peak. In all cases, the modified k-ε scheme can be seen to offer significantly improved performance over the standard k-ε model. The deficiency in the standard model is that it under-predicts the turbulence dissipation in the shear layer, which leads to too high a turbulence energy level, which in turn increases the diffusion of the mean velocity.
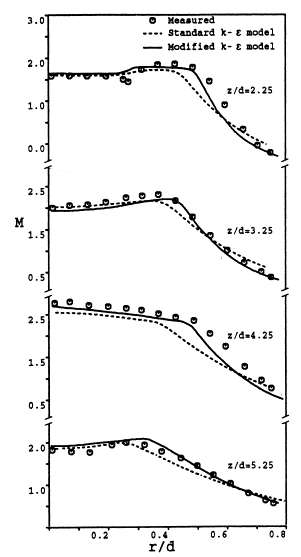
Figure 3 : Radial Values of Mach Number, taken from Cumber et al. (1994), with experimental data of Seiner and Norum (1979). P1/P∞ = 1.45, M=2 Reproduced with permission from ASME publications.
Figure 4 shows a comparison of the standard and modified k-ε results for the streamwise fluctuating velocity, against the data of Seiner and Norum (1980). Both models, and the experimental data, show an increase in turbulence energy in regions of compression, and a decrease in areas of expansion. As suggested above, it can be seen here that the standard k-ε model, (in which the turbulence dissipation is too low), overpredicts the level of turbulence. Close to the jet origin, it can be seen that both models yeld too high a turbulence energy, which would suggest that the initial 5% values (Section 5.3) were too high. However, Cumber et al. observed that varying the inlet boundary values for k and ε produced no significant change in the results other than in the vicinity of the nozzle itself.
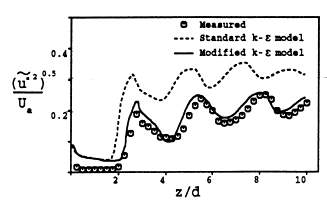
Figure 4: Axial values of fluctuating streamwise velocity at r/d=0.5 taken from Cumber et al. (1994), with experimental data of Seiner and Norum (1980), P1/P∞ = 1.45, M=2 Reproduced with permission from ASME publications.
A corresponding plot is also available from Bartosiewicz et al (2002), and is shown in Figure5. (Note that the scaling on the axes are different between Figures 4 and 5: The x-axis is normalized with jet diameter on Fig 4 and jet radius on Fig 5; and the y-axis is normalized with a reference velocity (![]() ) on Fig 4, but with the jet exit velocity on Fig 5).
) on Fig 4, but with the jet exit velocity on Fig 5).
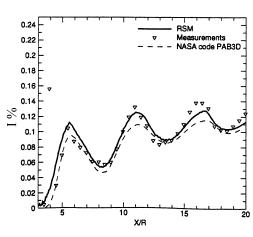
Figure 5: Axial values of fluctuating streamwise velocity at r/d=0.5 taken from Bartosiewicz et al. (2002), with experimental data of Seiner and Norum (1980), P1/P∞ = 1.45, M=2. Reproduced with permission from Y. Bartosiewicz.
Figure 5 shows two sets of experimental data, the solid line is as computed by Bartosiewicz et al (2002), using their second moment closure, and the dotted line shows results using a k-ε scheme, published by Pao and Abdol-Hamid (1996) with their NASA code PAB3D. For interest, the PAB3D work is computed using the same, Sarkar-modified turbulence model as used by Cumber et al (Fig 4), and shows broadly similar results to those from Cumber using this modified k-ε model.
The RSM results of Bartosiewicz (Fig 5, solid line) do, however, show some improvement over the k-ε results, certainly over the first two shock cells, yielding close agreement of both shock location, and turbulence intensity.
We are also able to evaluate the CFD performance at computing the axial pressure for the moderately under-expanded jet studies. Figure 6 shows a comparison of the centreline pressure with the experimental values for three models considered by Cumber et al (1994). The first two plots (Fig 6a, 6b) show the standard, and the modified, k-ε schemes respectively; then the final (Fig 6c) plot incorporates both a modified constant in the epsilon equation (see below), and a slight phase shift. Figure 6a, for the standard k-ε scheme, shows good agreement, although with a slight phase difference, for the first 2 diameters downstream, but then after that, the decay in centreline pressure is too rapid. This is because of the over-prediction of the spreading of the shear layer.
The Sarkar-modified k-ε scheme (Fig 6b), is clearly in much better agreement with the experimental data for significantly further downstream, although again there is a slight phase difference, and far downstream, the spreading rate has again been over-predicted leading to too high a rate of decay of pressure.
A further adjustment is shown (Fig 6c), in which Cumber et al. have made two changes. Firstly, altering the dissipation constant C2 in the epsilon equation from its usual value of 1.92 down to 1.8. This reduces the spreading rate, and produces a more accurate rate of decay however, there is little other evidence to support changing this constant, so its widespread adoption cannot be endorsed. Nevertheless, this is useful information, since it indicates where further modelling effort could be beneficial. The second change was a phase shift in the downstream distance of d/2, which brings the results in much better agreement with experiment. The argument for this relates to the presence of boundary layers in the nozzle itself: It has been assumed for the CFD calculations that there would be a flat profile at the nozzle exit, however in reality, there would have been some boundary layer effects, resulting in the wave from the nozzle being reflected into the jets core slightly sooner.
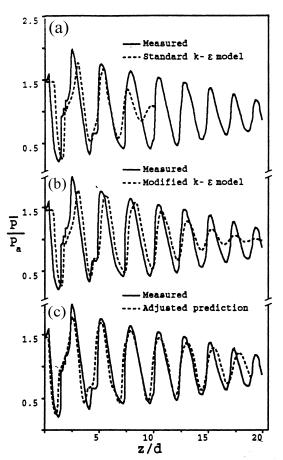
Figure 6 : Centreline values of static pressure, taken from Cumber et al. (1994), with experimental data of Seiner and Norum (1979). P1/P∞ = 1.45, M=2 Reproduced with permission from ASME publications.
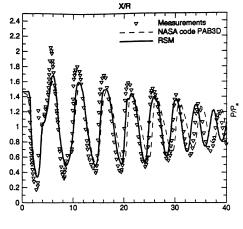
Figure 7 : Centreline values of static pressure, taken from Bartosiewicz et al (2002), with with experimental data of Seiner and Norum (1979). P1/P∞ = 1.45, M=2 Reproduced with permission from Y. Bartosiewicz.
Similar results are shown by Bartosiewicz et al (2002), and presented in Figure 7. There is a curious disagreement between the PAB3D results (Fig 7, dashed line), and Cumbers equivalent model (Fig 6b). Certainly, for the first 10 diameters downstream, both k-ε schemes show similar results with a slight phase shift from the experiment. However, further downstream (>15diameters / 30 radii) Cumbers results show a rapid decay in amplitude, not apparent in the PAB3D computations.
The reader may observe that there is a similarity between Cumbers adjusted predictions, (Fig6c) which modified the constant in the epsilon equation, and those from PAB3D (Fig7), however, there is nothing in Pao & Abdol-Hamid to suggest that they made the same modifications to PAB3D, and so this remains a mystery.
The RSM results of Bartosiewicz (Fig 7, solid line), are arguably the best results in terms of the magnitude of the pressure oscillations, although they too exhibit a slight phase change beyond 32 radii downstream.
6.2 the Highly Under-expanded Jet:
The following results consider the application of various turbulence models to the computation of the highly under-expanded jet.
CFD results are taken from both Cumber et al. (1995), for the k-ε schemes; and from Bartosiewicz et al. (2002) for the RSM schemes.
Experimental data from Donaldson and Snedeker (1971) is used by both of the CFD authors for assessing their models. Although the pressure ratios are higher for the Donaldson & Snedeker work than with the Seiner & Norum work, (P1/P∞ = 3.57 instead of 1.45), the use of a convergent nozzle results in the exit Mach number now being unity, instead of the M=2 seen before.
Figure 8 shows the computed Mach number distribution, from Cumber at als k-ε modeling, based on Donaldson & Snedekers jet. The contours are plotted at an interval of ΔM=0.2, from M=0.8 (off the jet axis) to M=3.4 close to the nozzle exit. This was found to be similar to experimental measurements, showing two Mach disks (from Cumbers CFD) at z/d=1.68 and z/d=3.33, compared to the experimental values of z/d=1.58 and z/d=3.36. The diameters of these Mach disks was computed as dm/d=0.62 and dm/d=0.32, compared with the experimental values of dm/d=0.59 and dm/d=0.30. A triple point is also evident at r/d=0.3, ''z/d''=1.7. <center>[[Image:U1-01d32_files_image046.gif]]</center> Figure 8 : Predicted Mach number contours. Taken from Cumber et al. (1995), and based on the experimental study of Donaldson and Snedeker (1971), with ''P<sub>1</sub>/P<sub>∞ </sub>'' = 3.57, and ''M''=1 Reproduced with permission from ASME publications. Figure 9 shows a comparison of the mean streamwise velocity for the highly under-expanded jet at four different downstream locations, as computed in the CFD work of Cumber et al (1995). For the first two plots, at ''z/d=''1.96 and ''z/d=''3.92, the velocity in the jet core can be seen to be subsonic close to the axis (these plots are close to the two Mach discs, which were predicted to be at ''z/d''<nowiki>=1.58 and z/d=3.33). There is little difference between the two k-ε based turbulence models, although, as before, the standard k-ε model predicts greater lateral spreading of the jet.
The second two plots in Figure 9, (for downstream distances of z/d=7.32 and z/d=11.7) do, however, show greater difference between the two eddy viscosity models. Again, as with the moderately under-expanded jet, the standard model shows more rapid decay of the jet, and corresponding increased lateral spreading, as would be expected. Unlike the other results though, it is now the standard model whose results are in closer agreement with experiment. However, as stated in Section 4, Donaldson & Snedeker reported that there was a flapping instability in their jet, downstream of the two Mach disks. The averaging technique used would result in the peak velocities being flattened, and the radial spread being exaggerated. If this is the case, then the results from the modified model could be assumed to be in better agreement with experiment, but based on current information, it is impossible to quantify this discrepancy.
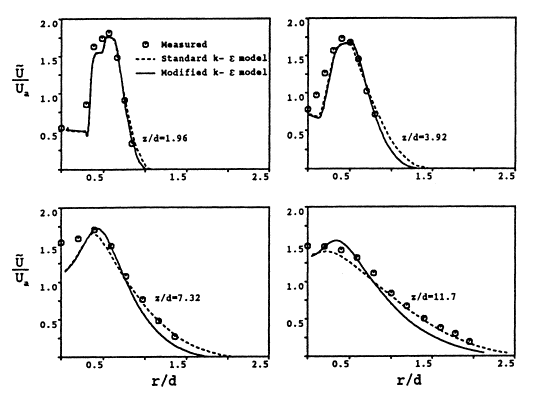
Figure 9 : Radial mean streamwise velocity at four downstream locations, (computed with k-ε models), taken from Cumber et al. (1995), and based on the experimental study of Donaldson and Snedeker (1971). Reproduced with permission from ASME publications.
Figure 10 shows a corresponding plot (to that of Figure 9), however, taken from the RSM computational modeling of Bartosiewicz et al (2002). In all cases, away from the jet axis, the RSM results appear to be almost identical to those from the modified k-ε modeling shown in Figure 9. However, nearer to the jet axis, the RSM modeling tends to overpredict the mean velocity, in regions where the k-ε modeling under-predicts this.
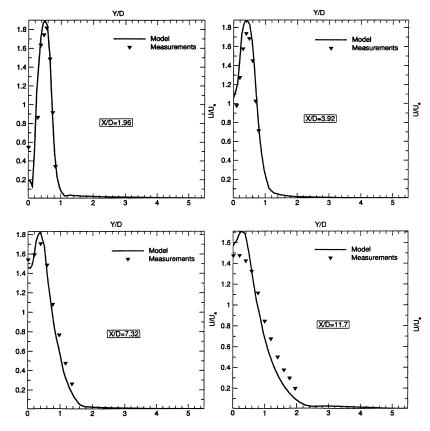
Figure 10 : Radial mean streamwise velocity at four downstream locations, (computations with RSM scheme) taken from Bartosiewicz et al (2002), and based on the experimental study of Donaldson and Snedeker (1971). Reproduced with permission from Y. Bartosiewicz
At first glance, it would appear that neither model (modified k-ε nor RSM) could be declared to be superior. Equally, however, it was known that Donaldson & Snedekers experimental data exhibited a flapping instability, and the averaging used would result in the data points appearing to be flattened. Hence, the peak experimental velocity may have been higher that that shown, in which case, the RSM results, as presented by Bartosiewicz et al. (Fig 10) could be argued to be slightly superior over the modified k-ε results from Cumber et al. (Fig 9).
6.3 Conclusions
In summary, the underlying-flow-regime considered here has been that of the under-expanded jet, of which there are two distinct types: moderately- and highly- under-expanded. The latter, which occurs at higher pressure ratios, exhibits one or more Mach Discs - shock waves, normal to the jets axis.
CFD results have been presented, which compare the predicted values with experimental data for both types of jet. The CFD modelling has considered the use of three different turbulence models: a standard eddy-viscosity model (Jones & Launder 1972); a eddy-viscosity model modified with the inclusion of an additional dissipation term (Sarkar et al.1991); and a second-moment (RSM) closure. From this work, the following conclusions can be drawn:
- There is a surprising dearth of good quality, validated, CFD data for this UFR. The few studies that there have been tend to concentrate on the effects of jet impingement or far-field dispersion from an under-expanded source.
- In order to resolve the jets near-field correctly, the CFD method must be able to capture the complex shock formation from the jets source.
- For the eddy-viscosity turbulence models, a mesh spacing of the order d/64 is needed in the vicinity of the shocks, for grid-independent solutions.
- Mesh adaption can, therefore, help produce an efficient mesh, refined only where needed.
- The standard k-ε scheme makes a reasonable prediction of the jet. However, the dissipation rate of k tends to be too low, resulting in k being too great. Consequently, this model tends to show too great a diffusion of the mean velocity. Hence at a given downstream location, the axial velocity decays too rapidly, and the radial spread of the jet is too great.
- On the whole, the modifications proposed by Sarkar et al. (1991) make a worthwhile improvement to the jets prediction, correcting the issues noted above. However, for the case of the highly under-expanded jet, beyond the first two Mach disks, the predictions from the classic k-ε scheme were seen to be in closer agreement with experiment, but this may be attributable to instabilities in the experiment.
- There are some benefits in adopting a standard second moment closure methodology, although the results seen here are only slightly superior over the Sarkar-modified k-ε scheme.
- More recent work (eg Leschziner, 2001) imply that superior predictions can be attained using a realizable second moment closure. However, their application was more complex than the one considered here (and indeed, to the authors knowledge, such models are not yet available in commercial software).
© copyright ERCOFTAC 2004
Contributors: Chris Lea - Health & Safety Laboratory