UFR 3-18 Evaluation: Difference between revisions
m (UFR 3-18 Evaluation moved to Silver:UFR 3-18 Evaluation) |
No edit summary |
||
| Line 68: | Line 68: | ||
{{UFR|front=UFR 3-18|description=UFR 3-18 Description|references=UFR 3-18 References|testcase=UFR 3-18 Test Case|evaluation=UFR 3-18 Evaluation|qualityreview=UFR 3-18 Quality Review|bestpractice=UFR 3-18 Best Practice Advice|relatedACs=UFR 3-18 Related ACs}} | {{UFR|front=UFR 3-18|description=UFR 3-18 Description|references=UFR 3-18 References|testcase=UFR 3-18 Test Case|evaluation=UFR 3-18 Evaluation|qualityreview=UFR 3-18 Quality Review|bestpractice=UFR 3-18 Best Practice Advice|relatedACs=UFR 3-18 Related ACs}} | ||
Revision as of 17:21, 29 August 2009
2D Boundary layers with pressure gradients (B)
Underlying Flow Regime 3-18 © copyright ERCOFTAC 2004
Evaluation
Comparison of CFD calculations with Experiments
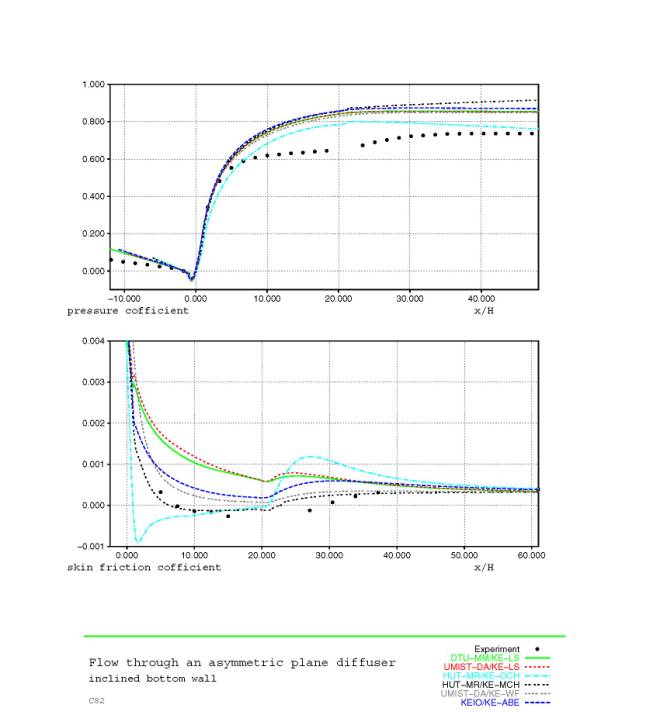
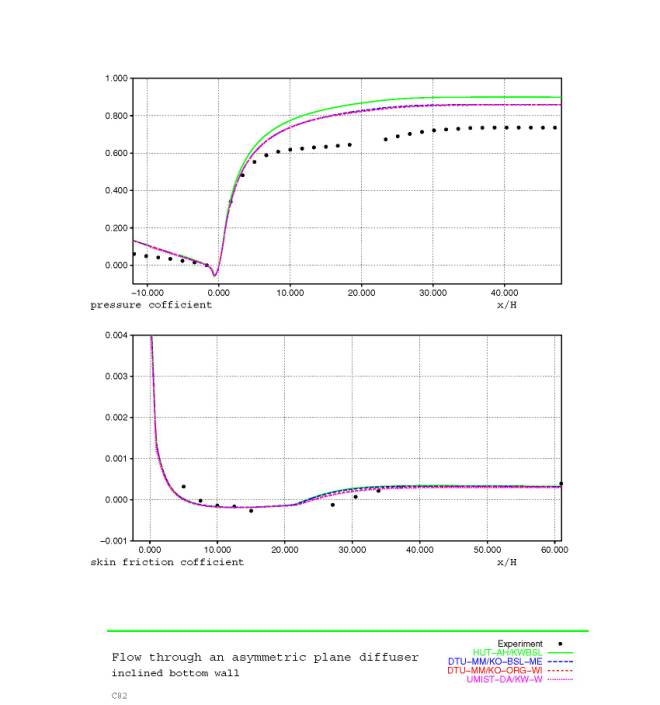
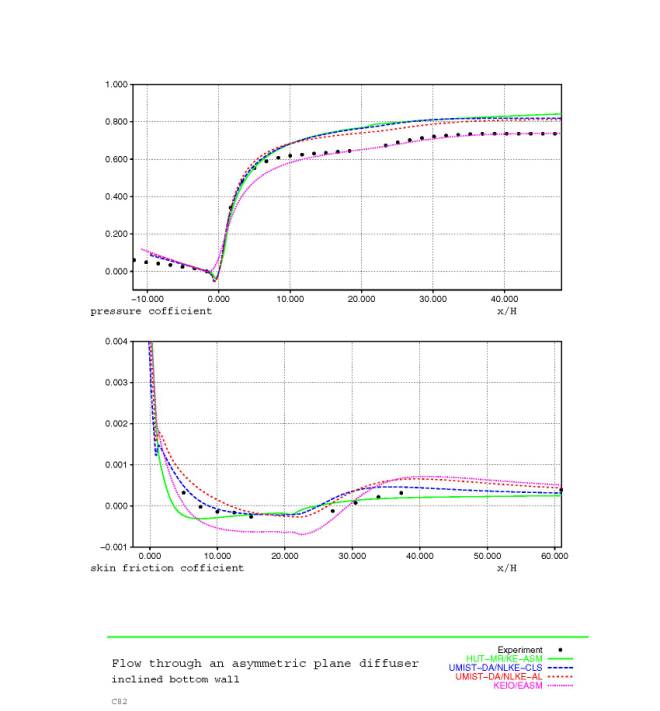
Detailed performance of the models can be derived from the predicted profiles of mean velocity and Reynolds stresses and the various stream-wise locations. Summaries are given here with respect to the skin friction coefficient variation along the bottom inclined wall, which uniquely defined the separation, reattachment and boundary layer recovery characteristics.
All k-ε models (Group A, see Figure 2) with the exception of the Chien variants, fail to predict separation. The Chien variants reattach too early. The downstream pressure recover too quickly.
Group B models performed very consistent as seen in Figure 3, all predicting separation and reattachment at approximately the same location, both being too early compared with experiment. The downstream pressure recovery is too fast, consistent with early reattachment.
The advanced linear models (Group C, Figure 4) were mostly consistent in the sense of separating earlier than the Group B models and reattaching later. The reattachment point is very close to the experimental value. Pressure recovery is improved, but still over-predicted.
In Figure 5, the non-linear k-ε models of Group D are all seen to separate, with varying degrees of success. Pressure recovery is further improved.
Group E non-linear k-ω models illustrated in Figure 6 all separate and reattach earlier than the experiment, with improved recovery characteristics compared with their linear/advanced counterparts.
Of the Group F models, Figure 7, all except the Hanjalic-Jakirlic calculation separate. The Gibson-Launder Reynolds Stress model predicts the separation and reattachment points very well, but underpredicts the skin-friction in the re-circulation. Only the LES prediction shows consistency across all assessment parameters, producing the best profiles of mean velocity and stress components, pressure recovery. The reattachment point is slightly over predicted, but this improves in the later report [5] in which the downstream boundary was extended further.
The V2F model performs excellently in terms of separation and reattachment points, mean velocity profiles in the re-circulation zones.
Figures
and from LES (CTR-KFMLM): Group F
© copyright ERCOFTAC 2004
Contributors: Fred Mendonca - Computational Dynamics Ltd


