
Abstr:UFR 3-33
Turbulent flow past a wall-mounted hemisphere
Abstract
The objective of the present contribution is to provide a detailed experimental and numerical investigation on the turbulent flow past a smooth and rigid wall-mounted hemispherical obstacle. For this purpose, the hemisphere (diameter D) is exposed to a thick turbulent boundary layer of the thickness δ = D/2 at Re = 50,000. In order to generate the desired boundary layer in the experiment, a combination of specific fences is placed in the upstream region of the wind tunnel. Detailed measurements of the inflow conditions are realized using laser-Doppler and hot-film anemometry. Furthermore, the experimental data are utilized to generate inflow conditions for the numerical simulation that match the experimental inflow conditions. These clearly defined boundary and operating conditions are the prerequisites for a combined experimental and numerical investigation of the flow field relying on laser-Doppler anemometry measurements and on large-eddy simulations.
The numerical results are produced by a finite-volume Navier-Stokes solver for block-structured curvilinear grids. A fine wall-resolving mesh is applied resulting from a preliminary study. An additional analysis is conducted to select a suitable subgrid-scale model.
The final investigation includes a profound analysis on the unsteady flow features observed in the vicinity of the hemisphere like the horseshoe vortex, the recirculation area, the hairpin structure or the vortex shedding processes. A detailed discussion of the time-averaged flow field comprising the mean velocity field as well as the Reynolds stresses is provided. Owing to the proper description of the oncoming flow and the additional numerical studies guaranteeing the choice of an appropriate grid and subgrid-scale model, the experimental and numerical results are found to be in close agreement.
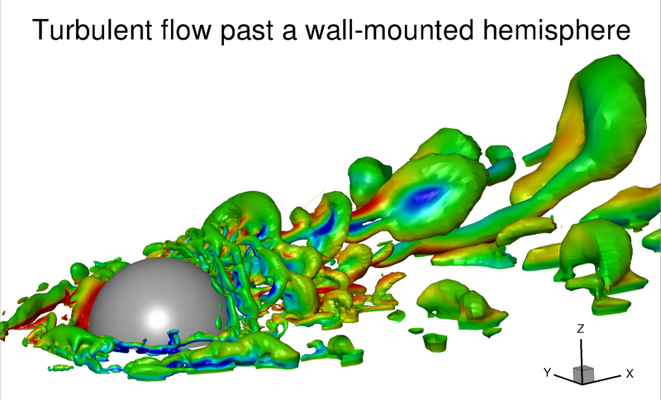
Fig. 1: Vortical structures visualized by utilizing the iso-surfaces of the pressure fluctuations (p'/(ρair U∞²) = -2.47 × 10⁻⁴) colored by the spanwise instantaneous velocity based on LES prediction.
Contributed by: Jens Nikolas Wood, Guillaume De Nayer, Stephan Schmidt, Michael Breuer — Helmut-Schmidt Universität Hamburg
© copyright ERCOFTAC 2024